Wedding Cost Statistics 2026: Mean, Median and Vendor Spending
Compare sourced wedding-cost benchmarks, a $24,000 median, vendor spending and prospective budgets. Original charts, downloadable data and survey limits.
Sources and methods reviewed October 3, 2026. Tools use your inputs; survey figures retain their original observation years.
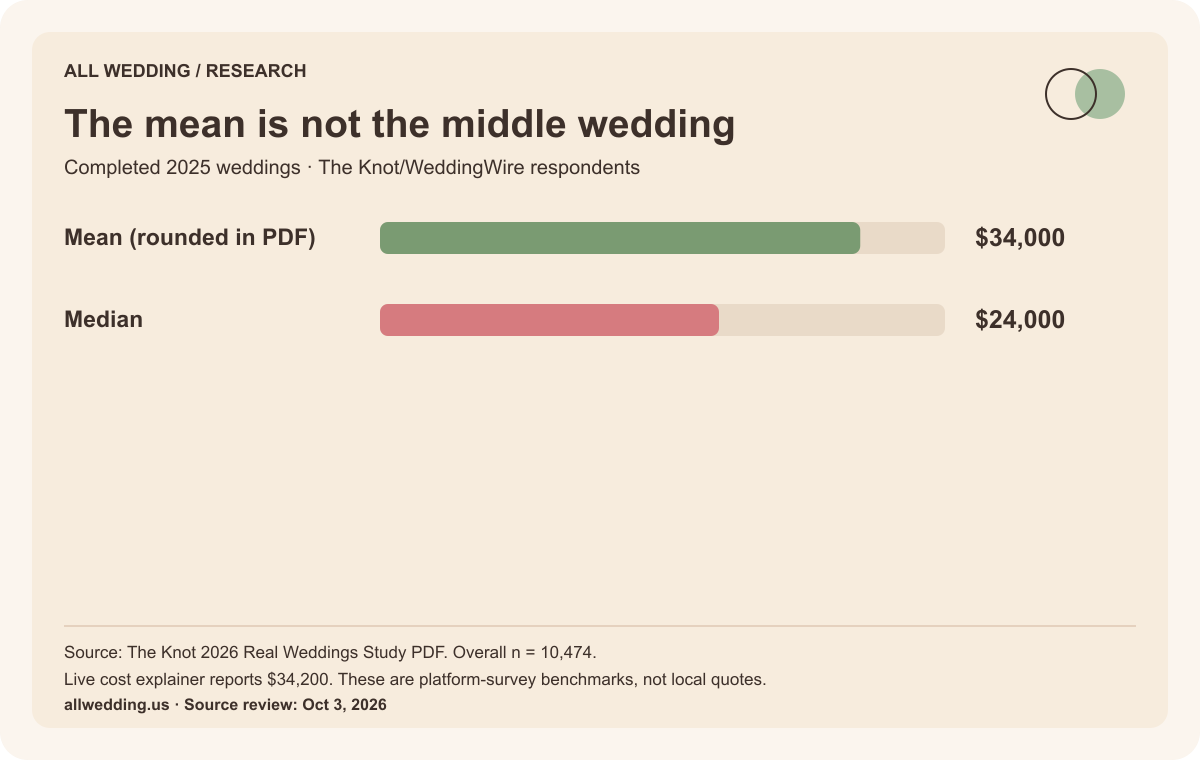
The Knot's 2026 report puts the rounded mean cost of completed 2025 weddings at $34,000 and the median at $24,000. Its live cost article presents the mean as $34,200. Zola's prospective 2026 report gives a $36,000 headline average. These figures describe different summaries or cohorts; combining them would create a number none of the studies actually measured. The Knot report, live cost article, Zola report.
Use the figures below to understand the distribution, then use written quotes to build your wedding. The most useful budget question is which services and quantities your money must cover.
Wedding cost statistics at a glance
| Measure | Reported value | Year and source |
|---|---|---|
| Mean wedding cost (report PDF)The Knot/WeddingWire respondents with completed 2025 weddings. Rounded figure in report PDF | $34,000 | 2025 · The Knot |
| Median wedding costThe Knot/WeddingWire respondents with completed 2025 weddings | $24,000 | 2025 · The Knot |
| Lower-quartile boundaryThe Knot/WeddingWire respondents with completed 2025 weddings. Approximately 25% at or below this amount | $12,000 | 2025 · The Knot |
| Upper-quartile boundaryThe Knot/WeddingWire respondents with completed 2025 weddings. Approximately 25% above this amount | $41,000 | 2025 · The Knot |
| Mean wedding cost (live explainer)The Knot/WeddingWire respondents with completed 2025 weddings. Different published precision from report PDF | $34,200 | 2025 · The Knot |
| Headline average, prospective reportZola respondents planning 2026 weddings. Different cohort and timing; do not blend with completed 2025 outcomes | $36,000 | 2026 · Zola |
Download this table as CSV · Source metadata and caveats are included.
The Knot recruited 10,474 adult US couples married during 2025 through The Knot and WeddingWire membership. Zola describes more than 11,500 couples getting married in 2026 in its report index. Neither published platform population should be treated as a census of every US marriage.
Why the median is lower than the mean
Embed this graphic with its source note
Our original graphic is available under CC BY 4.0. Credit All Wedding and retain the underlying source and scope. This permission covers our graphic, not a publisher's complete report.
A mean adds spending and divides by the number of observations. A median is the midpoint after ordering the observations. Very expensive weddings can pull the mean upward while leaving the middle wedding much lower.
The $10,000 gap between the rounded PDF mean and median is a difference between summary measures, not a discount available to a couple. The mean is approximately 41.7% above the median: ($34,000 ÷ $24,000 − 1) × 100. That calculation uses the PDF's precision throughout.
This matters when a couple sees a national average and assumes they are under-budgeted. A median provides additional context, but it still does not price their venue, city, guest list or service level. A smaller wedding with extensive production can cost more than a larger, simpler event.
What the spending distribution shows
Embed this graphic with its source note
Our original graphic is available under CC BY 4.0. Credit All Wedding and retain the underlying source and scope. This permission covers our graphic, not a publisher's complete report.
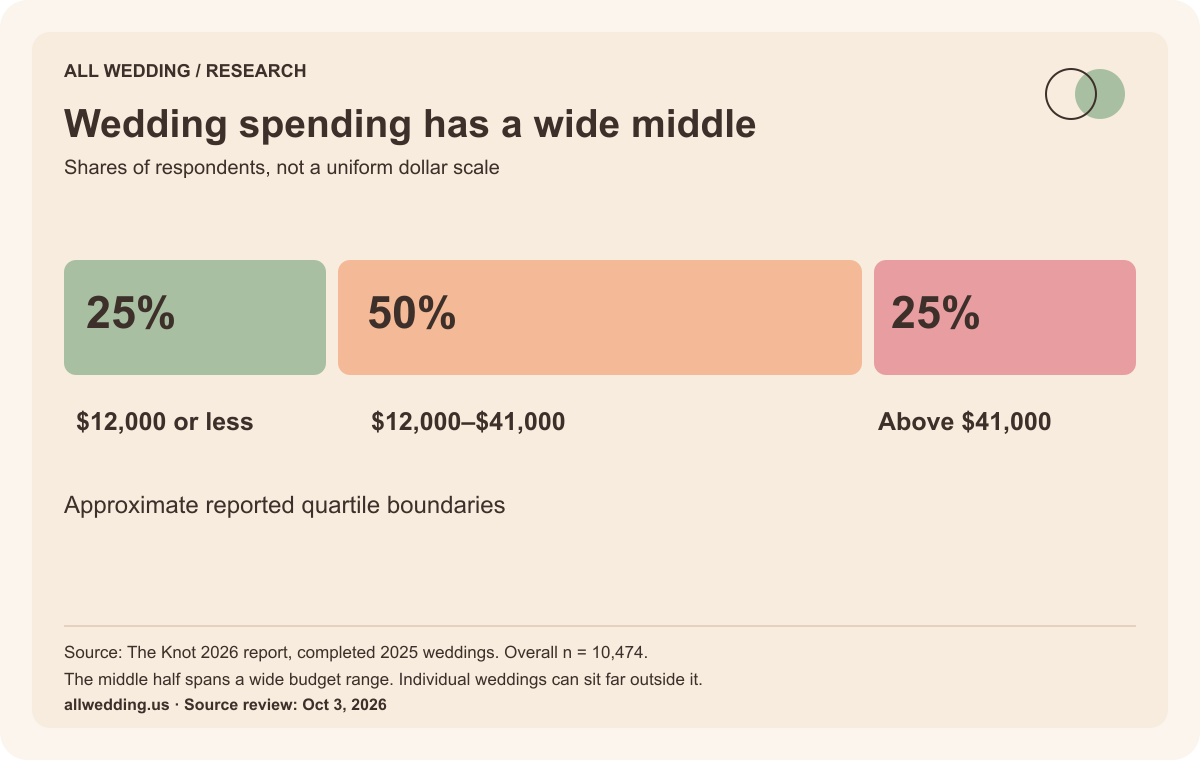
The report describes approximately a quarter spending $12,000 or less, the middle half between $12,000 and $41,000, and a quarter above $41,000. Those boundaries are not price packages. The middle range alone spans $29,000, which is why one headline average cannot meaningfully prescribe every wedding budget.
The chart's blocks represent shares of respondents. They are not a histogram with equal-width dollar bands, and they do not imply spending is evenly spread within each band. We have not published a smooth distribution or percentile calculator because the underlying individual responses are not available.
Wedding vendor spending by category
| Category | Reported hiring | Mean spend |
|---|---|---|
| Wedding dress | 91% | $2,100 |
| Venue | 89% | $12,900 |
| Photographer | 88% | $3,000 |
| Caterer | 85% | $80/person |
| Groom’s attire | 84% | $330 |
| Cake | 76% | $530 |
| Hair and makeup | 72% | $300 |
| DJ | 71% | $1,800 |
| Event rentals | 68% | $2,000 |
| Florist | 59% | $2,800 |
Source: The Knot 2026 report, vendor table. Category subgroups differ; the caterer figure is per person. Do not sum the table into an average wedding budget.
Download the vendor spending table.
The caterer figure is per person; most other rows are total category spend. Adding $80 of catering to a $12,900 venue total would mix units. Even after converting catering to a guest total, summing all category means would be misleading: not everyone hires every category, subgroup populations differ, and some packages may bundle services.
For a real comparison, identify what each proposal includes. A venue may include tables, staff or food. Another venue may require separate suppliers for those items. The vendor comparison worksheet makes required extras visible before you compare totals.
Completed weddings versus planned budgets
The Knot's retrospective survey asks about completed 2025 events. Zola's First Look report describes a cohort planning 2026 events. Plans can change before the final bill. Differences between the headlines could reflect timing, membership, budget mix, questions or inclusions; these sources alone do not isolate the cause.
The $36,000 prospective headline is not evidence that all 2026 weddings ended at that amount. Nor does the difference from The Knot's figure measure annual wedding inflation. A defensible inflation study would need comparable populations, scope, timing and methods across years.
Keep the citation attached to the number: “The Knot's completed 2025 respondents” and “Zola's couples planning 2026 weddings” tell readers far more than “the average wedding.”
Turn benchmarks into a working budget
Start with vendors in your city. Get dated proposals from venues, photographers, planners and bakeries for the same event brief.
Separate fixed quotes from guest-dependent costs. Enter actual fee bases and quoted tax amounts; do not assume that a service charge includes a tip or that all vendors apply the same taxes. Use the budget calculator to test scenarios, then send consistent vendor inquiry emails to close gaps.
Compare the quotes' scope as well as their totals. Availability, coverage, staff, delivery, setup, venue restrictions and change deadlines can alter what an apparently inexpensive package delivers.
Sources and citation notes
The tables retain published values and observation years. The PDF's rounded $34,000 mean and the explainer's $34,200 are both shown; no unpublished reconciliation is claimed. Graphics and derived arithmetic are All Wedding's work based on the cited reports. These are platform-survey benchmarks, not our own consumer survey.
To cite this compilation, use All Wedding, Wedding Cost Statistics, reviewed October 3, 2026, linking to the section or chart and retaining the underlying report attribution. Original SVGs, PNGs and CSVs are available above.
Primary sources · checked October 3, 2026
- The Knot 2026 Real Weddings Study, full reportCompleted 2025 weddings. 10,474 adult US couples married January–December 2025. Recruited by email from The Knot/WeddingWire membership. Category-specific denominators and confidence intervals are not supplied here. Category spending is not additive. The report also includes ad hoc engaged/newlywed research; do not assign all supplemental findings to the main cohort.
- The Knot study methodologyCompleted 2025 weddings. The Knot/WeddingWire survey respondents. Retrospective platform-member survey. Does not constitute a probability sample of every US marriage.
- The Knot average wedding cost explainerCompleted 2025 weddings. 2026 Real Weddings Study respondents. Live explainer states $34,200; PDF states a rounded $34,000 mean and $24,000 median. Retain source-specific precision.
- Zola 2026 First Look ReportCouples planning 2026 weddings. Surveyed engaged couples. Prospective planning cohort. $36,000 is the report's headline average; not a completed-wedding outcome comparable on identical terms with The Knot's 2025 cohort.
- Zola First Look survey descriptionCouples planning 2026 weddings. More than 11,500 couples getting married in 2026. Publisher's report index describes more than 11,500 respondents. No recruitment/weighting detail or exact per-question denominator established in the retrieved report.