Wedding Vendor Statistics: Hiring, Spending and Supplier Choice
Which wedding vendors couples hire, what the survey actually measures, and how to compare a team. Original charts and downloadable 2025 hiring data.
Sources and methods reviewed October 3, 2026. Tools use your inputs; survey figures retain their original observation years.
The Knot's completed 2025 wedding sample averaged 13 hired vendors. Its category table reports 89% hiring a venue, 88% a photographer and 85% a caterer. These are overlapping choices made by platform-survey respondents, not the market share of each profession. Primary study PDF.
This resource separates hiring, spending and directory coverage. For a couple, its practical use is identifying services to consider and questions to resolve, rather than treating a surveyed average as a mandatory team size.
Which wedding vendors did couples hire?
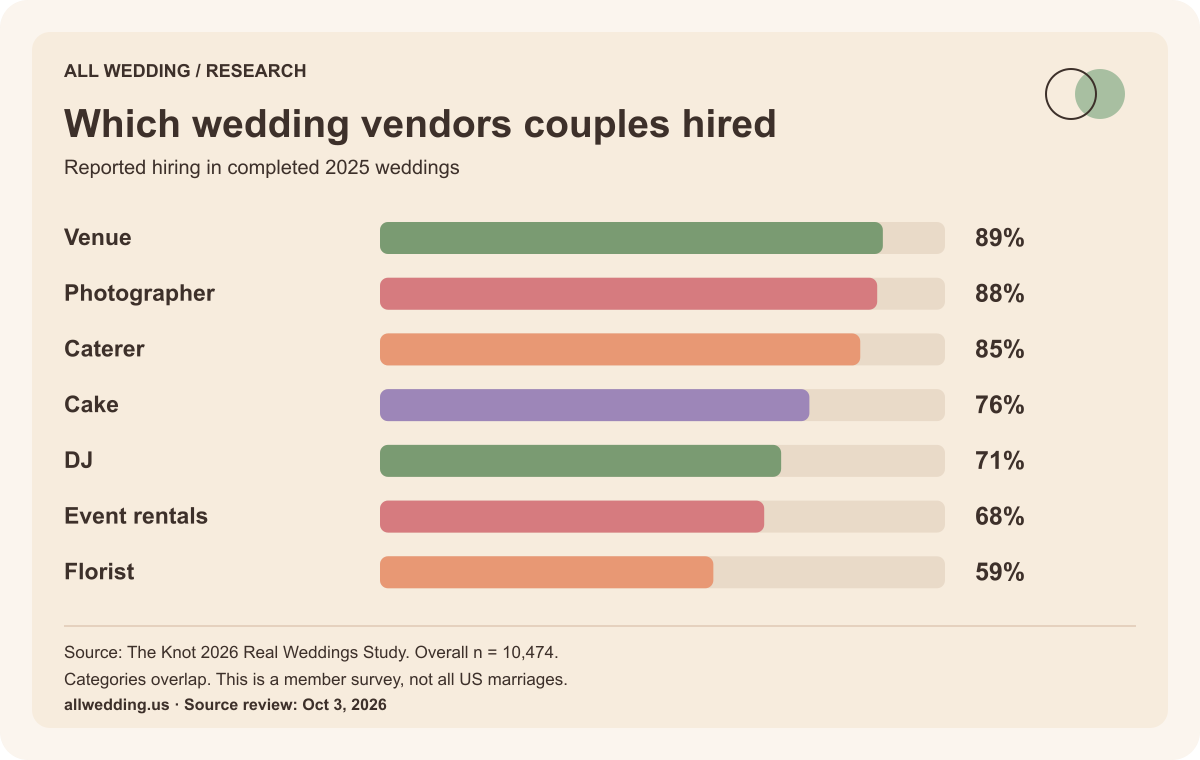
Embed this graphic with its source note
Our original graphic is available under CC BY 4.0. Credit All Wedding and retain the underlying source and scope. This permission covers our graphic, not a publisher's complete report.
| Measure | Reported value | Year and source |
|---|---|---|
| Hired wedding dressThe Knot/WeddingWire respondents with completed 2025 weddings | 91% | 2025 · The Knot |
| Hired venueThe Knot/WeddingWire respondents with completed 2025 weddings | 89% | 2025 · The Knot |
| Hired photographerThe Knot/WeddingWire respondents with completed 2025 weddings | 88% | 2025 · The Knot |
| Hired catererThe Knot/WeddingWire respondents with completed 2025 weddings | 85% | 2025 · The Knot |
| Hired groom’s attireThe Knot/WeddingWire respondents with completed 2025 weddings | 84% | 2025 · The Knot |
| Hired cakeThe Knot/WeddingWire respondents with completed 2025 weddings | 76% | 2025 · The Knot |
| Hired hair and makeupThe Knot/WeddingWire respondents with completed 2025 weddings | 72% | 2025 · The Knot |
| Hired djThe Knot/WeddingWire respondents with completed 2025 weddings | 71% | 2025 · The Knot |
| Hired event rentalsThe Knot/WeddingWire respondents with completed 2025 weddings | 68% | 2025 · The Knot |
| Hired floristThe Knot/WeddingWire respondents with completed 2025 weddings | 59% | 2025 · The Knot |
Download this table as CSV · Source metadata and caveats are included.
The percentages cannot be added to make 100%. The same event can hire a photographer, caterer, florist and DJ. A lower hiring percentage also does not mean the service is unnecessary: some couples bundle it through a venue, use a different format, enlist personal support or choose not to include it.
The table covers categories published in the report, not every possible supplier. It does not establish the hiring rate for videographers, transport companies, officiants or content creators. An absent row is missing evidence, not zero demand.
What does an average of 13 vendors mean?
The report's average is an observed count in its wedding cohort. It is not a checklist requirement. Providers within a package may also be counted differently from separate businesses hired directly; the public read-out does not offer enough detail to reconstruct every respondent's count.
Define your own responsibilities before choosing businesses. Someone must own venue access, food service, photography, guest communications, timing and cleanup if those are part of the event. Some jobs can be handled by one contracted team. Other jobs need separate specialists because of geography, venue rules or the event's complexity.
Our planning checklist records tasks and owners. The vendor inquiry templates cover ten supplier categories without implying every wedding needs all ten.
Hiring percentages and category spending are different
| Category | Reported hiring | Mean spend |
|---|---|---|
| Wedding dress | 91% | $2,100 |
| Venue | 89% | $12,900 |
| Photographer | 88% | $3,000 |
| Caterer | 85% | $80/person |
| Groom’s attire | 84% | $330 |
| Cake | 76% | $530 |
| Hair and makeup | 72% | $300 |
| DJ | 71% | $1,800 |
| Event rentals | 68% | $2,000 |
| Florist | 59% | $2,800 |
Source: The Knot 2026 report, vendor table. Category subgroups differ; the caterer figure is per person. Do not sum the table into an average wedding budget.
The spending rows describe category-related responses. They do not allocate one complete national budget. The catering figure is per person, while venue and photography amounts are total-category figures. See the cost statistics and methodology before reusing these numbers.
For comparison work, ask providers for the same guest count, date, locations and coverage. Then normalize mandatory charges and required missing items using the comparison worksheet. A lower base price can become a higher complete proposal once the scope matches.
Provider choice is about evidence and fit
The report says photography examples were a top factor for 81% of couples selecting a photographer, and price for 73%. Personality was a top factor for 53% selecting a DJ; responsiveness for 52% selecting a planner. These are different category-specific questions. Exact subgroup sizes are not published in the read-out, so avoid assigning the overall 10,474 sample size to every measure. Vendor section.
For a photographer, a full gallery answers a different question from a polished social feed. For a DJ, a planning conversation can clarify announcements, pronunciation and handling requests. For a planner, a scope document can establish what they own and when their work begins. The survey findings support looking at these distinctions; they do not rank any individual provider.
What our directory can and cannot tell you
The All Wedding directory benchmark contains 3,061 imported listing records across 51 city markets and four populated categories. Those are records in a dated dataset. They are not a deduplicated count of all US wedding businesses, a consumer hiring study, or a current market-share estimate.
Directory coverage is useful for seeing where our catalog has depth and where more submissions would help. It cannot establish which city has the highest wedding demand. Cities with fewer imported records may have extensive local suppliers outside our dataset.
Find current public venues, photographers, planners and bakeries, then visit each profile and confirm availability and scope directly. The catering section accepts provider submissions; the imported benchmark contains no caterer records.
Reuse the data responsibly
Our hiring CSV includes units, year, population and source links. Keep those fields when quoting or redrawing the data. The percentages describe The Knot/WeddingWire respondents with completed 2025 weddings; the page's 2026 review date does not change that observation year.
For niche details, explore venue statistics, photography statistics, cake statistics, catering statistics, flower statistics and DJ statistics.
Primary sources · checked October 3, 2026
- The Knot 2026 Real Weddings Study, full reportCompleted 2025 weddings. 10,474 adult US couples married January–December 2025. Recruited by email from The Knot/WeddingWire membership. Category-specific denominators and confidence intervals are not supplied here. Category spending is not additive. The report also includes ad hoc engaged/newlywed research; do not assign all supplemental findings to the main cohort.
- The Knot study methodologyCompleted 2025 weddings. The Knot/WeddingWire survey respondents. Retrospective platform-member survey. Does not constitute a probability sample of every US marriage.