Wedding Cake Statistics: Hiring, Spending and Cake Cutting
Source-checked cake hiring and spending figures, including the publisher's $530/$540 discrepancy. Original graphics, CSV data and serving-planning tools.
Sources and methods reviewed October 3, 2026. Tools use your inputs; survey figures retain their original observation years.
The Knot's completed 2025 wedding research reports 76% hiring a cake vendor and 72% including cake cutting. Its PDF vendor table lists $530 average cake spend, while the live cake-cost article reports $540. We show both versions instead of treating the difference as a price trend. Study PDF, cake-cost article.
Cake hiring, a ceremonial cutting moment and dessert portions are different questions. The useful next step is translating your guest list and design brief into an itemized bakery proposal.
Wedding cake statistics with source notes
| Measure | Reported value | Year and source |
|---|---|---|
| Hired cakeThe Knot/WeddingWire respondents with completed 2025 weddings | 76% | 2025 · The Knot |
| Average cake spendCake-related survey responses; subgroup n not disclosed | $530 | 2025 · The Knot |
| Included cake cuttingThe Knot/WeddingWire respondents with completed 2025 weddings | 72% | 2025 · The Knot |
| Average cake spend (live explainer)Cake-related survey responses; subgroup n not disclosed. Live explainer differs from PDF's $530 | $540 | 2025 · The Knot |
Download this table as CSV · Source metadata and caveats are included.
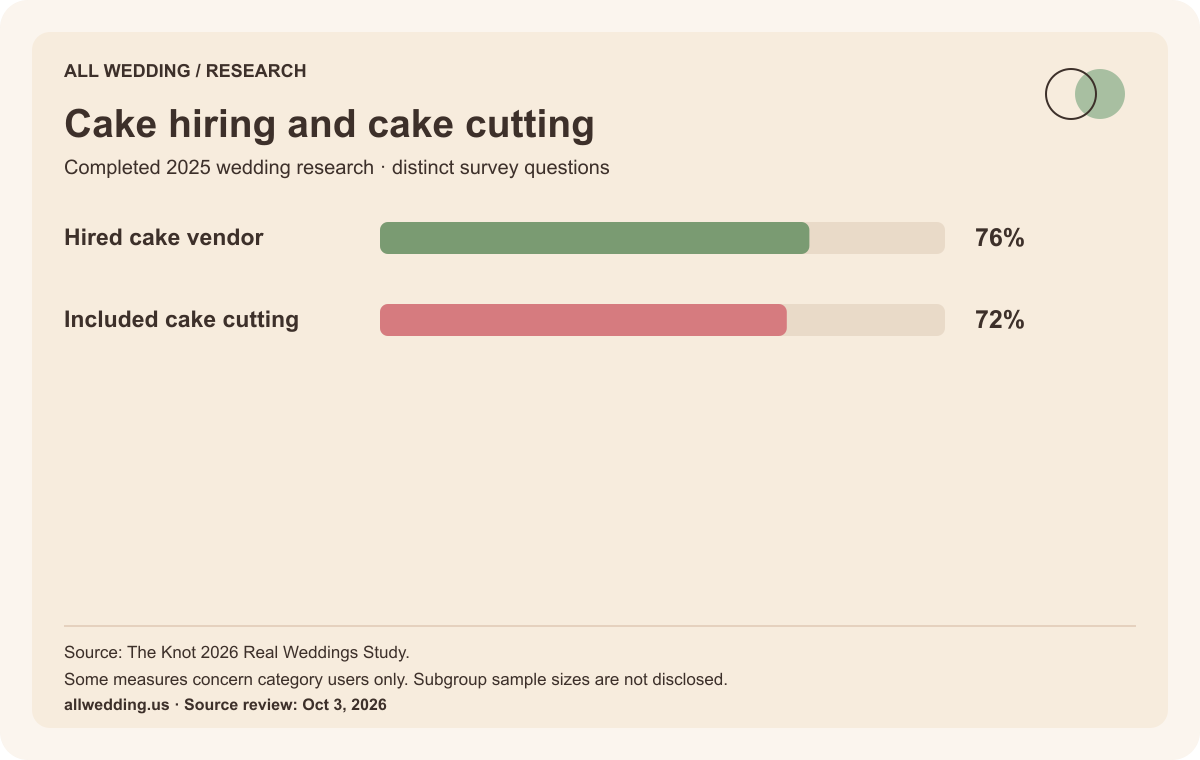
Embed this graphic with its source note
Our original graphic is available under CC BY 4.0. Credit All Wedding and retain the underlying source and scope. This permission covers our graphic, not a publisher's complete report.
The broader study included 10,474 adult US couples married during 2025, recruited from The Knot/WeddingWire membership. Exact cake-question response counts are not provided in the public read-out. These percentages should not be described as all US weddings.
Why two published cake averages differ
The study PDF and live explainer both attribute their findings to the current Real Weddings Study, but publish different cake averages. The retrieved pages do not explain the $10 discrepancy. We cannot determine from public evidence whether it reflects rounding, a revision or another difference.
For consistency, the cross-vendor table uses the PDF's $530. The cake-specific table also shows the live $540 figure and its source. A writer can cite either source faithfully, but should not claim the difference proves that prices increased between two years.
Neither average prices a particular cake. Portions, design, ingredients, preparation, transport, setup, venue access and other requested work belong in the proposal. See wedding cost statistics for the wider mean–median and subgroup issues.
Cake cutting does not determine dessert quantities
The 72% cake-cutting statistic describes an event moment. It does not say everyone received the same cake or that the cake served the whole room. Likewise, the 76% hiring figure does not tell us the share who combined a display cake with another dessert.
Do not subtract these percentages to infer the number of couples who hired a baker without cutting cake. The public report does not provide the joint responses needed for that calculation.
For your event, decide which desserts you will serve, how many portions you intend to provide, and whether any portions will be saved. Then ask your baker and caterer to confirm their responsibilities.
Plan portions before choosing tiers
Use the wedding cake serving calculator. It counts diners, your chosen participation share, extra portions and saved portions. You enter the display cake's serving yield from the baker.
Tier count by itself is insufficient. Height, diameter and portion dimensions change yield, and decorative or dummy tiers may not supply edible portions. We do not publish a universal tier-to-guests conversion.
If you plan a smaller display cake plus supplemental portions, ask for both quantities in writing. Agree on where extra portions are stored, who plates them, when they are served, and any venue or caterer charges. The calculator models counts; it does not select a cake structure or predict appetite.
Compare bakery proposals using the same brief
Give each baker your date, venue, estimated diners, design priorities and dietary requests. Ask which requests they can accommodate and how they communicate ingredients and handling. A design preference and an allergy-related request require different conversations.
Normalize the price using the vendor comparison worksheet. Check tastings, delivery, setup, stands, cutting and collection. If one proposal excludes a required service, add its confirmed cost before comparing.
Keep a display-cake price separate from a per-portion quote. A single ceremonial piece and a dessert plan for a large reception are different scopes. No national mean resolves that difference.
Find a baker and cite the facts
Browse wedding bakeries, New York bakeries, Dallas bakeries or Los Angeles bakeries. Confirm current availability and use the cake inquiry template for comparable responses.
Our original graphic and CSV retain the observation year and source. Credit the original survey when citing the statistics and All Wedding when reusing the compilation or artwork. Our directory benchmark measures imported bakery records, not national bakery supply.
Primary sources · checked October 3, 2026
- The Knot 2026 Real Weddings Study, full reportCompleted 2025 weddings. 10,474 adult US couples married January–December 2025. Recruited by email from The Knot/WeddingWire membership. Category-specific denominators and confidence intervals are not supplied here. Category spending is not additive. The report also includes ad hoc engaged/newlywed research; do not assign all supplemental findings to the main cohort.
- The Knot study methodologyCompleted 2025 weddings. The Knot/WeddingWire survey respondents. Retrospective platform-member survey. Does not constitute a probability sample of every US marriage.
- The Knot cake cost and methodologyCompleted 2025 weddings. Cake-related survey responses. Live cake page reports $540; study PDF category table reports $530. Disclose version discrepancy; no undocumented reconciliation.