US data · 2026 source review
Wedding Statistics 2026: US Marriage Data and Trends
The latest year on the CDC table retrieved for this resource is 2023: 2,041,926 registered marriages and a rate of 6.1 per 1,000 people. Census first-marriage age estimates cover 2025. The title's year is the review year, not the observation year of every statistic.
How many marriages happen in the US?
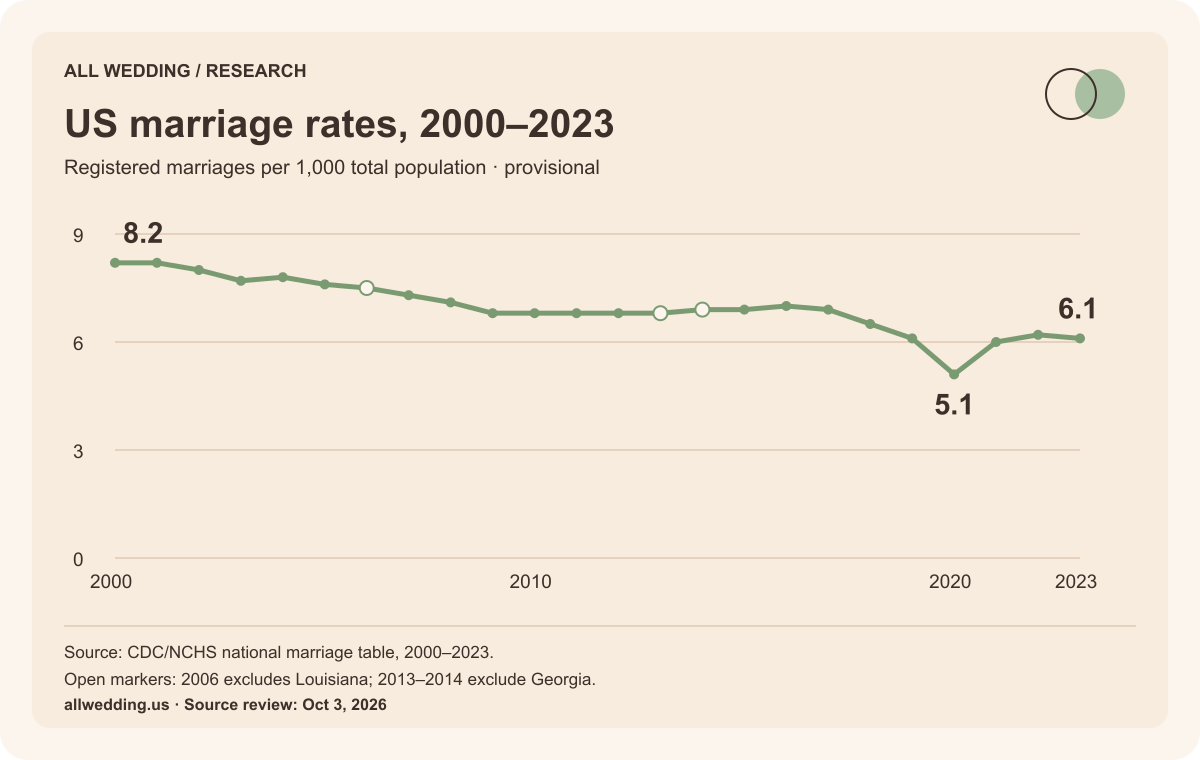
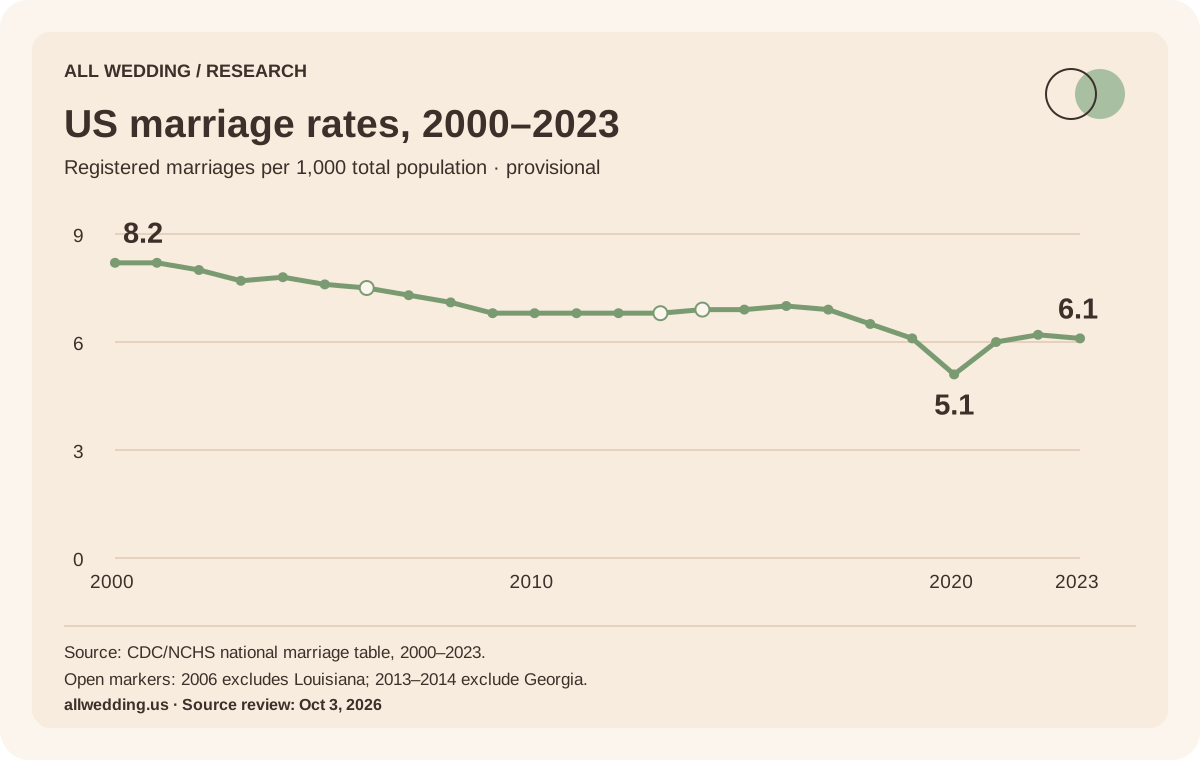
CDC/NCHS recorded 2,041,926 provisional US marriages in 2023, compared with 2,065,905 in 2022. The crude marriage rates were 6.1 and 6.2 per 1,000 total population. These are registrations, including marriages without a large reception. They do not tell us how many couples hired wedding professionals. CDC national table.
Embed this graphic with its source note
Our original graphic is available under CC BY 4.0. Credit All Wedding and retain the underlying source and scope. This permission covers our graphic, not a publisher's complete report.
In count terms, 2023 was 21.8% above 2020: (2,041,926 ÷ 1,676,911 − 1) × 100. It was about 1.3% above 2019. This measures registered marriage volume; it does not establish that spending or vendor bookings rose at the same pace.
The crude rate fell from 8.2 in 2000 to 6.1 in 2023. It divides marriages by the whole population, including children and already-married people. It is not the percentage of unmarried adults who marry and is not interchangeable with Census measures using women aged 15 and older.
| Year | Marriages | Rate per 1,000 population | Coverage note |
|---|---|---|---|
| 2023 | 2,041,926 | 6.1 | No state exclusion flagged in source |
| 2022 | 2,065,905 | 6.2 | No state exclusion flagged in source |
| 2021 | 1,985,072 | 6.0 | No state exclusion flagged in source |
| 2020 | 1,676,911 | 5.1 | No state exclusion flagged in source |
| 2019 | 2,015,603 | 6.1 | No state exclusion flagged in source |
| 2018 | 2,132,853 | 6.5 | No state exclusion flagged in source |
| 2017 | 2,236,496 | 6.9 | No state exclusion flagged in source |
| 2016 | 2,251,411 | 7.0 | Revised Illinois figures |
| 2015 | 2,221,579 | 6.9 | No state exclusion flagged in source |
| 2014 | 2,140,272 | 6.9 | Excludes Georgia |
| 2013 | 2,081,301 | 6.8 | Excludes Georgia |
| 2012 | 2,131,000 | 6.8 | No state exclusion flagged in source |
| 2011 | 2,118,000 | 6.8 | No state exclusion flagged in source |
| 2010 | 2,096,000 | 6.8 | No state exclusion flagged in source |
| 2009 | 2,080,000 | 6.8 | No state exclusion flagged in source |
| 2008 | 2,157,000 | 7.1 | No state exclusion flagged in source |
| 2007 | 2,197,000 | 7.3 | No state exclusion flagged in source |
| 2006 | 2,193,000 | 7.5 | Excludes Louisiana |
| 2005 | 2,249,000 | 7.6 | No state exclusion flagged in source |
| 2004 | 2,279,000 | 7.8 | No state exclusion flagged in source |
| 2003 | 2,245,000 | 7.7 | No state exclusion flagged in source |
| 2002 | 2,290,000 | 8.0 | No state exclusion flagged in source |
| 2001 | 2,326,000 | 8.2 | No state exclusion flagged in source |
| 2000 | 2,315,000 | 8.2 | No state exclusion flagged in source |
Download all 24 annual observations as CSV. The file retains population, rate and coverage notes. The 2006 figures exclude Louisiana; 2013–2014 exclude Georgia. Hollow chart markers identify those years.
At what age do people first get married?
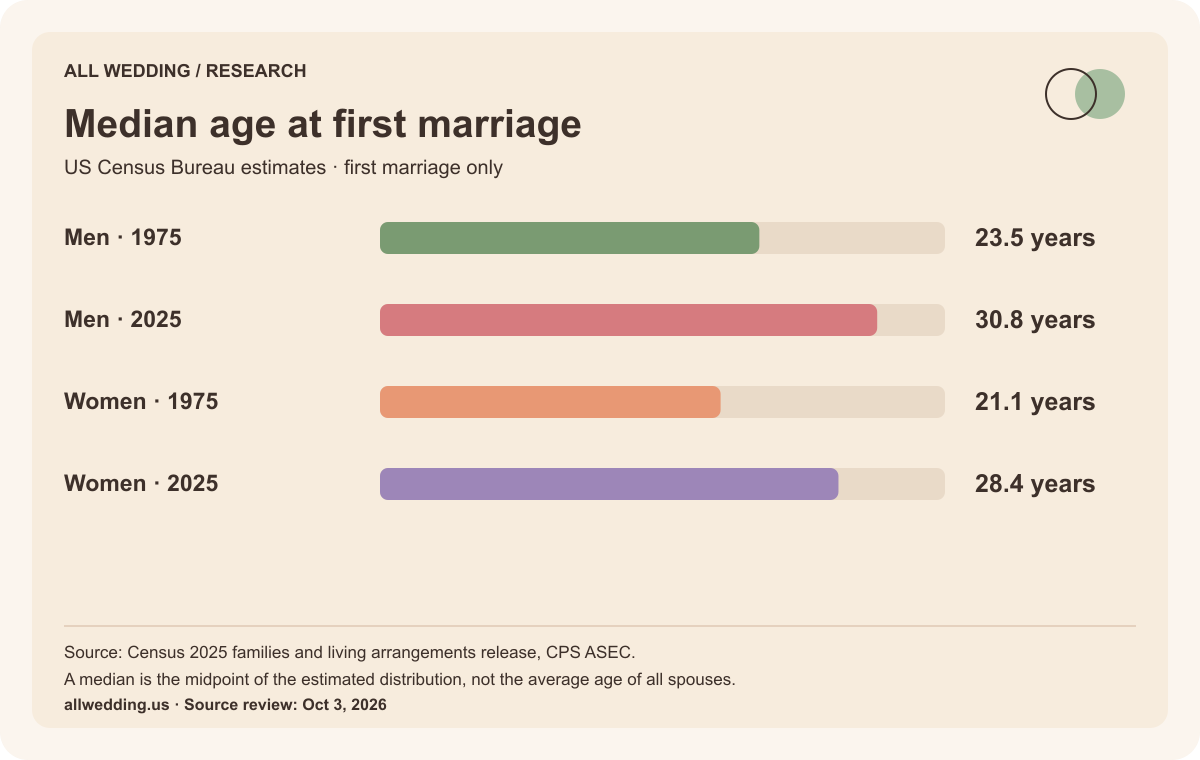
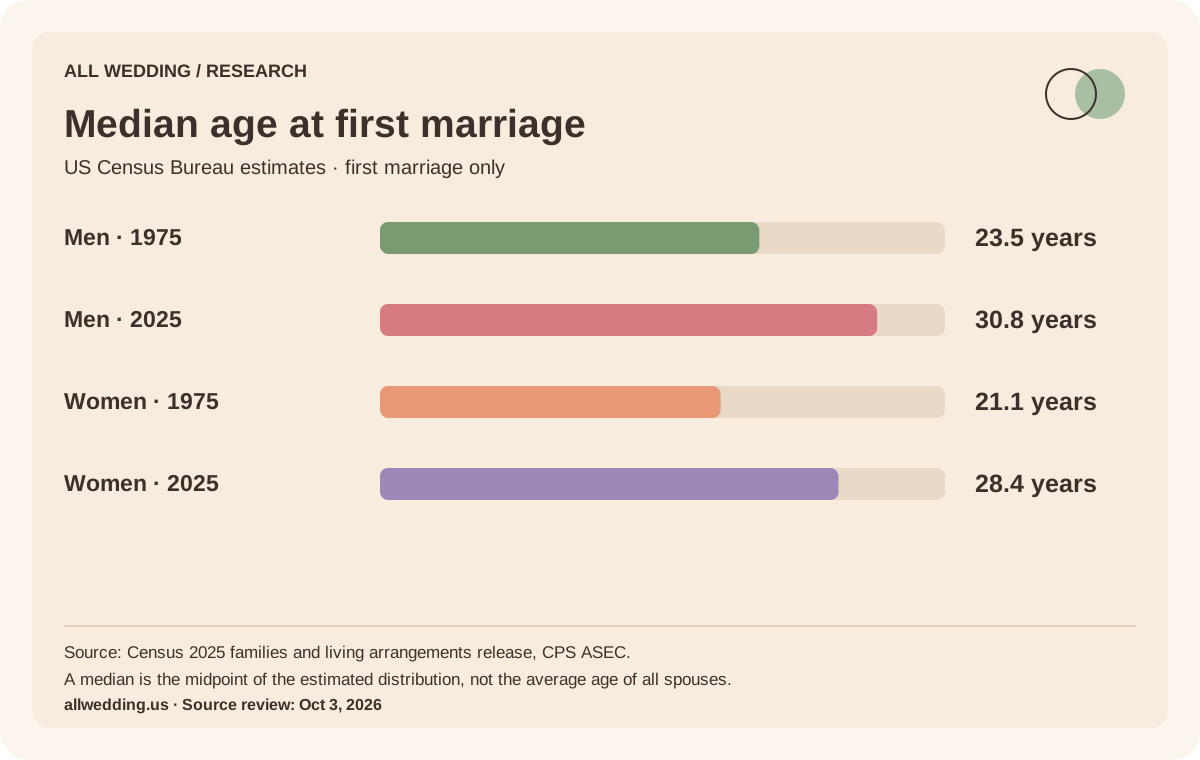
Census estimated a median first-marriage age of 30.8 for men and 28.4 for women in 2025. Its 1975 comparison was 23.5 and 21.1. Both published categories increased by 7.3 years. These are CPS Annual Social and Economic Supplement estimates for first marriages. Census December 2025 release.
Embed this graphic with its source note
Our original graphic is available under CC BY 4.0. Credit All Wedding and retain the underlying source and scope. This permission covers our graphic, not a publisher's complete report.
A first-marriage median does not describe every wedding customer. Remarriages and people outside these published categories are not summarized by these two numbers. Ask about the actual couple's needs rather than infer budget, tastes or family support from age.
What do wedding cost statistics measure?
The Knot's 2026 report describes completed 2025 weddings among 10,474 respondents recruited from The Knot/WeddingWire membership. Its PDF reports a rounded $34,000 mean and $24,000 median; the live cost explainer gives $34,200 for the mean. Zola's First Look report gives $36,000 for a different, prospective 2026 cohort. The Knot report. Live cost explainer. Zola report.
Our wedding cost statistics separate the cohorts and explain the mean–median gap. Use the budget calculator to build a plan from written quotes. A survey average is neither a required spend nor a local estimate.
How many vendors do couples hire?
The Knot's completed 2025 sample averaged about 13 hired vendors. Reported hiring included venues at 89%, photographers at 88% and caterers at 85%. Categories overlap; these are not slices of one total or percentages of every registered marriage. Vendor and planning sections.
Explore vendor hiring statistics, photography statistics, cake statistics and venue statistics. Our directory benchmark measures a separate imported-record cohort. It cannot estimate national supplier counts or market share.
How long do couples spend planning?
The report gives an average engagement of 14 months, average planning time of seven hours per week, and 76% of weddings between May and October. These sample descriptions do not prove a universal deadline, seasonal discount or workload for your wedding. Planning and date-selection sections.
Use the planning statistics for definitions and our planning checklist to assign work. Your suppliers' availability and written deadlines determine your schedule.
How to cite and use this resource
We retrieved the primary sources with Firecrawl and checked observations, populations, units and source notes on October 3, 2026. Government registrations, Census estimates and platform surveys remain separate. The graphics are original redraws of cited facts. Derived arithmetic shows its formula.
Cite a fact with its original publisher and observation year. Credit our compilation or graphics as All Wedding, Wedding Statistics, source review October 3, 2026, linking to the relevant section. Downloads and optional embed code retain source notes. A 2026 update never turns a 2023 observation into 2026 data.
Correction: this rebuild replaces earlier unlinked cost estimates and unsupported booking/discount figures with direct citations and explicit scopes. Inspect the source and data ledger.
Primary sources · checked October 3, 2026
- CDC/NCHS national marriage trends, 2000–20232000–2023. Registered marriages, by state of occurrence; provisional counts. Crude rates per 1,000 total population. 2006 excludes Louisiana; 2013 and 2014 exclude Georgia. Not a count of receptions or paid wedding events.
- CDC marriage and divorce definitions2023. US marriages. Latest observation on the retrieved FastStats page is provisional 2023. Do not label it 2026 marriage volume.
- Census 2025 families and living arrangements1975 and 2025. CPS Annual Social and Economic Supplement. Estimated median age at first marriage by the sex categories published in the release. A sample-based estimate, not the average age of all wedding customers.
- The Knot 2026 Real Weddings Study, full reportCompleted 2025 weddings. 10,474 adult US couples married January–December 2025. Recruited by email from The Knot/WeddingWire membership. Category-specific denominators and confidence intervals are not supplied here. Category spending is not additive. The report also includes ad hoc engaged/newlywed research; do not assign all supplemental findings to the main cohort.
- The Knot study methodologyCompleted 2025 weddings. The Knot/WeddingWire survey respondents. Retrospective platform-member survey. Does not constitute a probability sample of every US marriage.
- The Knot average wedding cost explainerCompleted 2025 weddings. 2026 Real Weddings Study respondents. Live explainer states $34,200; PDF states a rounded $34,000 mean and $24,000 median. Retain source-specific precision.
- Zola 2026 First Look ReportCouples planning 2026 weddings. Surveyed engaged couples. Prospective planning cohort. $36,000 is the report's headline average; not a completed-wedding outcome comparable on identical terms with The Knot's 2025 cohort.
- Zola First Look survey descriptionCouples planning 2026 weddings. More than 11,500 couples getting married in 2026. Publisher's report index describes more than 11,500 respondents. No recruitment/weighting detail or exact per-question denominator established in the retrieved report.
Find providers for your actual plans
Start with vendors by city, or compare venues, photographers, planners and bakeries. Request current availability and an itemized proposal, then use the comparison worksheet to align inclusions.