Wedding Planning Statistics: Engagement, Time and Planner Costs
Sourced planning-time, engagement, mobile activity and planner-cost statistics, with clear definitions, original graphics and a practical checklist.
Sources and methods reviewed October 3, 2026. Tools use your inputs; survey figures retain their original observation years.
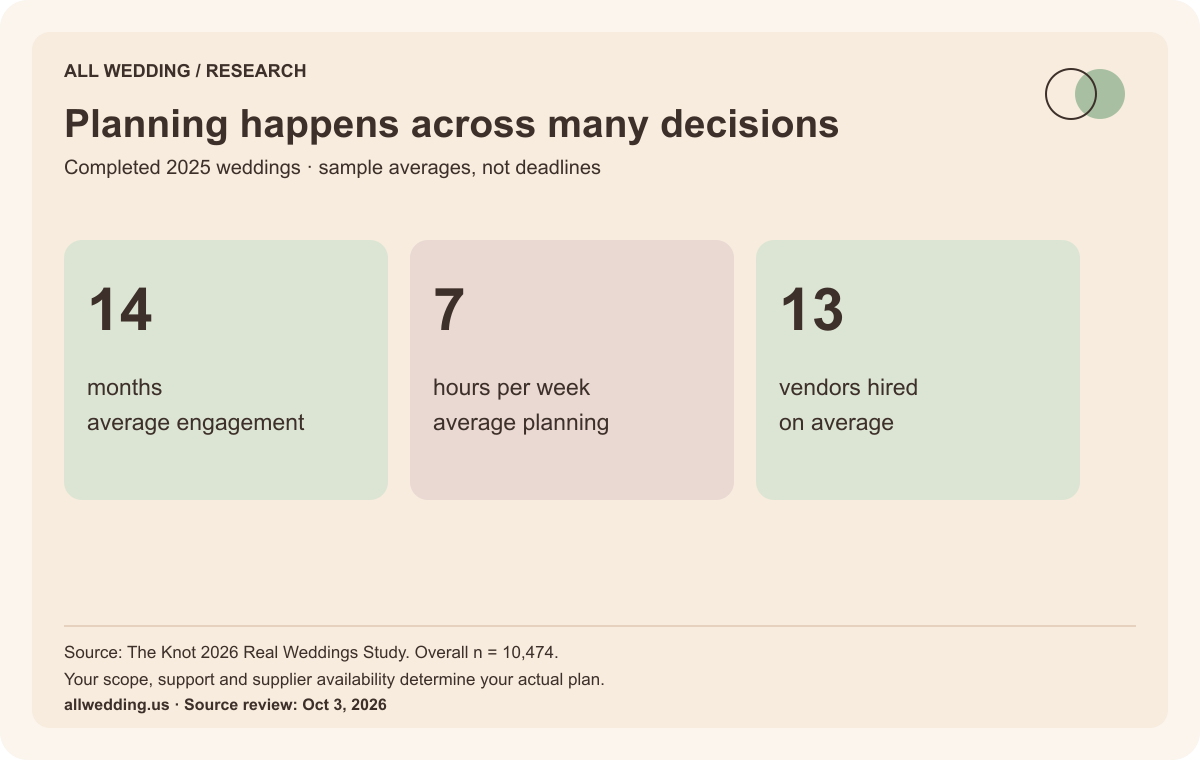
The Knot's completed 2025 sample reports an average 14-month engagement, seven hours of planning per week and 13 hired vendors. It also reports that 90% created a wedding website and 41% of planning was done on a mobile device. These are descriptions of surveyed behavior, not deadlines or requirements for your wedding. Primary report.
Planner pricing is a separate category measure. The publisher's planner-cost article gives a $2,100 overall average, with different averages for different types of support. The scope matters more than the package name.
Planning statistics you can cite
| Measure | Reported value | Year and source |
|---|---|---|
| Average engagementThe Knot/WeddingWire respondents with completed 2025 weddings | 14 months | 2025 · The Knot |
| Average weekly planning timeThe Knot/WeddingWire respondents with completed 2025 weddings | 7 hours per week | 2025 · The Knot |
| Average vendors hiredThe Knot/WeddingWire respondents with completed 2025 weddings | 13 vendors | 2025 · The Knot |
| Created a wedding websiteThe Knot/WeddingWire respondents with completed 2025 weddings | 90% | 2025 · The Knot |
| Planning done on a mobile deviceThe Knot/WeddingWire respondents with completed 2025 weddings. Share of planning activity, not share of couples | 41% | 2025 · The Knot |
| Weddings between May and OctoberThe Knot/WeddingWire respondents with completed 2025 weddings | 76% | 2025 · The Knot |
| Average planner spendPlanner-related survey responses; subgroup n not disclosed | $2,100 | 2025 · The Knot |
Download this table as CSV · Source metadata and caveats are included.
Embed this graphic with its source note
Our original graphic is available under CC BY 4.0. Credit All Wedding and retain the underlying source and scope. This permission covers our graphic, not a publisher's complete report.
The overall survey included 10,474 adult US couples married in 2025, recruited from The Knot/WeddingWire membership. Exact response counts for individual planning questions are not supplied in the public read-out.
Average planning time is not a workload forecast
Seven hours per week describes a sample average. It cannot tell you how much work is left on your wedding or how those hours were split between partners, family and professionals.
Multiplying the average engagement by the weekly average would not reliably estimate total hours for a particular couple. Engagement duration and weekly planning activity vary, and the report does not publish the joint person-level observations needed for that calculation.
A more useful plan lists tasks, owners, dependencies and actual deadlines. Our wedding planning checklist does that without assuming every wedding needs twelve months or the same set of suppliers.
Mobile planning and wedding websites are different measures
The 90% website figure concerns couples creating a wedding website. The 41% mobile figure concerns the share of planning activity conducted on a mobile device. Calling the latter “41% of couples plan on mobile” would change the measure.
For your event, decide which information guests need: dates, location, travel, accessibility, RSVP instructions and updates. The tool matters less than accurate information and a clear owner for keeping it current.
For a provider, these findings give context for making public information usable on phones. They do not prove that a particular website feature causes bookings or that paid placement improves conversion.
Planner costs vary with the support purchased
The Knot's planner-cost article reports these averages for its completed 2025 cohort:
| Published planner type | Reported average |
|---|---|
| Planner overall | $2,100 |
| Full-service or all-inclusive | $3,800 |
| Day-of support | $1,600 |
| Month-of coordination | $2,400 |
| Destination support | $2,700 |
The category-specific samples are not disclosed. Names also do not establish identical scope across businesses. “Day-of” can involve preparation before the event, and one company's “partial planning” may differ from another's.
Do not add these averages together or infer the share of every US couple using each service type. Compare responsibilities, start date, meetings, staffing, purchasing authority and communication instead.
Write a scope before comparing planners
List the work you want to own and the work you want someone else to manage. Ask each planner when their work begins, which vendors they coordinate, what documents they prepare and who attends on the day.
Confirm limits: meeting counts, revisions, locations, guest communications, design work, setup and vendor sourcing. Ask what additional support costs when the event changes.
Our comparison worksheet aligns proposals and highlights unknowns. Our planner inquiry template asks for a responsibility-based scope rather than only a package label.
Seasonal concentration is not a discount claim
The report says 76% of the sample's weddings occurred between May and October. That observation does not prove another month's prices are lower, or that all locations share the same peak season.
Check actual supplier availability for your dates. Weather, venue operations, cultural calendars and travel can matter as much as national seasonality. Ask for written alternatives if flexibility is part of your plan.
Find planners and keep the scope attached to the data
Browse wedding planners, New York planners, Dallas planners or Chicago planners. Confirm who will do the work, not only the business name.
Use the planning checklist, budget calculator and vendor statistics to keep decisions connected. Our charts and CSV retain observation year, unit and population so the findings remain usable when cited.
Primary sources · checked October 3, 2026
- The Knot 2026 Real Weddings Study, full reportCompleted 2025 weddings. 10,474 adult US couples married January–December 2025. Recruited by email from The Knot/WeddingWire membership. Category-specific denominators and confidence intervals are not supplied here. Category spending is not additive. The report also includes ad hoc engaged/newlywed research; do not assign all supplemental findings to the main cohort.
- The Knot study methodologyCompleted 2025 weddings. The Knot/WeddingWire survey respondents. Retrospective platform-member survey. Does not constitute a probability sample of every US marriage.
- The Knot wedding planner cost and methodologyCompleted 2025 weddings. Planner-related responses within the 2026 Real Weddings Study. Overall planner average $2,100; full-service $3,800, day-of $1,600, month-of $2,400, destination $2,700. Type-specific samples not disclosed; categories need not have identical scope.