Wedding Venue Statistics: Hiring, Cost and How Couples Choose
Sourced venue hiring and spending statistics, with original graphics, survey caveats and a practical path to comparing venue proposals.
Sources and methods reviewed October 3, 2026. Tools use your inputs; survey figures retain their original observation years.
In The Knot's completed 2025 wedding sample, 89% reported hiring a venue, and the published vendor table gives $12,900 average venue spend. The report also says 83% considered venue selection most important and 73% used planning websites or apps to find a venue. These are distinct survey questions, not interchangeable measures of demand. Study PDF.
A venue anchors many later decisions: layout, caterer access, rentals, arrival windows and weather arrangements. Use this data as context, then assess the actual space and proposal for your event.
Venue statistics with their original scope
| Measure | Reported value | Year and source |
|---|---|---|
| Hired venueThe Knot/WeddingWire respondents with completed 2025 weddings | 89% | 2025 · The Knot |
| Average venue spendVenue-related survey responses; subgroup n not disclosed | $12,900 | 2025 · The Knot |
| Venue selection cited as most importantThe Knot/WeddingWire respondents with completed 2025 weddings | 83% | 2025 · The Knot |
| Used planning websites/apps to find venueThe Knot/WeddingWire respondents with completed 2025 weddings | 73% | 2025 · The Knot |
Download this table as CSV · Source metadata and caveats are included.
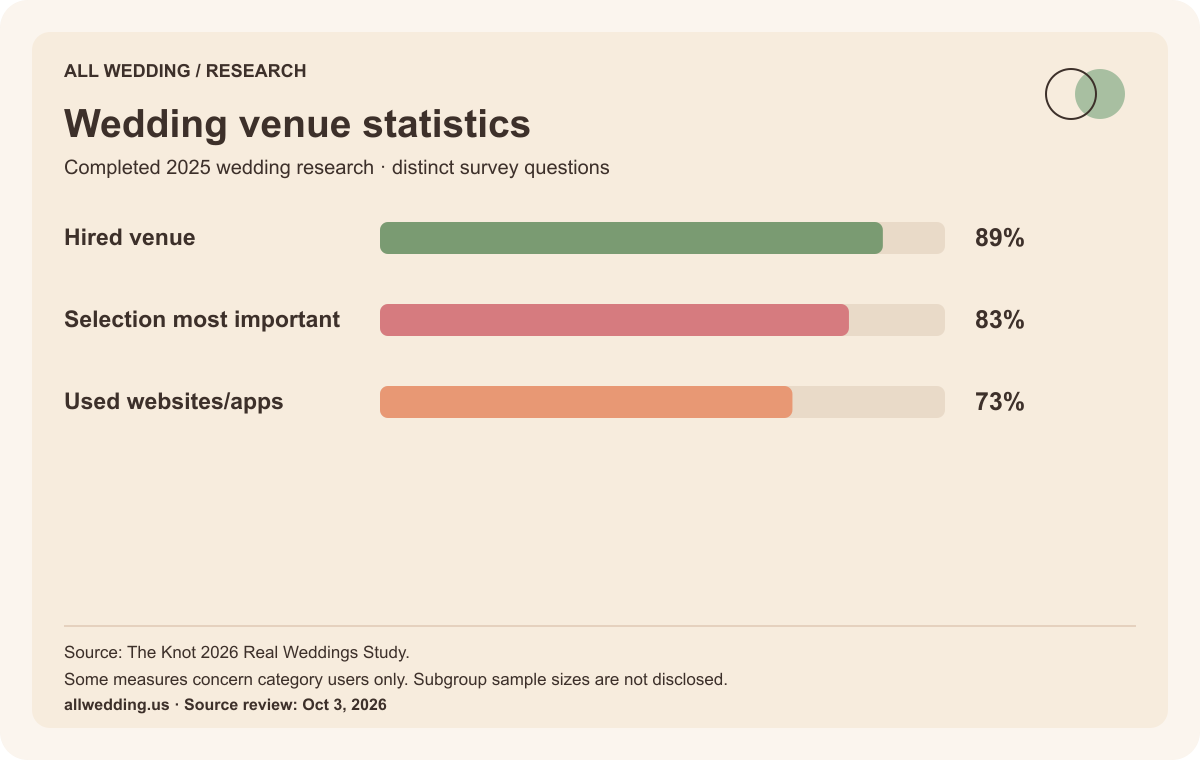
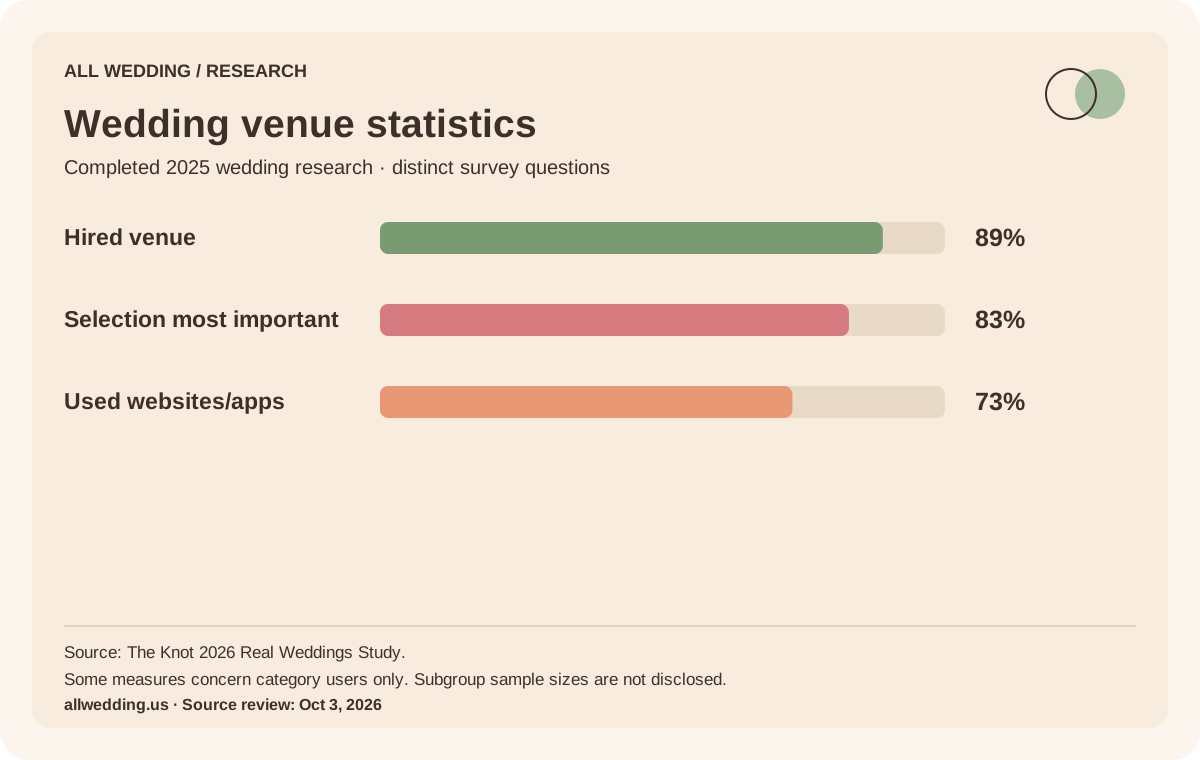
Embed this graphic with its source note
Our original graphic is available under CC BY 4.0. Credit All Wedding and retain the underlying source and scope. This permission covers our graphic, not a publisher's complete report.
The study's overall population is 10,474 adult US couples married in 2025, recruited from The Knot/WeddingWire membership. The report does not disclose an exact response count for every venue question. It should not be described as a census of all marriages or all venues.
What the venue cost average leaves unanswered
The $12,900 average is a total category benchmark, not a per-guest price, a square-foot rate or a promise about any particular city. It does not specify that every respondent bought the same hours, space or package.
One proposal may include ceremony use, tables, chairs, staff and cleanup; another may include only the space. Food and beverage may be separate or bundled. If the inclusions differ, subtracting one base quote from another does not measure savings.
Use the vendor comparison worksheet to add the missing required items, mandatory fees and quoted tax. Keep optional upgrades separate. For the broader spending distribution, see wedding cost statistics.
Why venue choice changes the rest of the team
The report's finding that venue selection matters to many respondents is consistent with a planning dependency: suppliers need to know where they will work. This is a practical inference, not a measured causal effect from the survey.
A caterer needs kitchen and service details. A florist needs installation access and attachment rules. A photographer needs to understand locations and timing. A DJ or band needs power, sound restrictions and a place to set up.
Before paying for a venue, document these constraints and share them with shortlisted suppliers. Do not assume that a preferred-vendor recommendation is a requirement, or that an outside vendor is allowed without fees. The venue's current written policy resolves that question.
What to measure on a venue tour
The venue tour checklist covers capacity for your proposed seated layout, accessibility, weather backup, itemized costs, delivery windows and the person responsible on the day. Record the answer for your actual date.
Capacity deserves special attention. A headline standing capacity may not describe a dinner layout with a dance floor, stage, buffet and accessible paths. Ask for a layout that fits those uses.
Weather backup is a logistics plan, not just the name of another room. Confirm capacity, decision timing, setup labor, additional costs and how guests move between spaces. The checklist lets you record unresolved answers rather than treating verbal assurances as completed planning.
Turn online discovery into a useful shortlist
The 73% website/app figure describes how this cohort found venue options. It does not prove that a directory listing guarantees bookings, or that every venue must buy advertising.
Start with wedding venues or city directories. Useful comparisons include New York venues, Dallas venues and Los Angeles venues. Verify each venue's actual availability, current package and policies.
Use the venue inquiry template to send the same brief to each candidate. Ask for a dated itemized proposal, then compare fit, complete cost and outstanding questions before making a decision.
Method and citation
These facts come from one platform-member survey. We preserve its observation year, units and category scope; we do not use the figures to estimate total US venue revenue or count local competitors. Original graphics and a source-rich CSV are provided above.
Related resources: vendor hiring statistics, wedding budget calculator, and the directory coverage benchmark.
Primary sources · checked October 3, 2026
- The Knot 2026 Real Weddings Study, full reportCompleted 2025 weddings. 10,474 adult US couples married January–December 2025. Recruited by email from The Knot/WeddingWire membership. Category-specific denominators and confidence intervals are not supplied here. Category spending is not additive. The report also includes ad hoc engaged/newlywed research; do not assign all supplemental findings to the main cohort.
- The Knot study methodologyCompleted 2025 weddings. The Knot/WeddingWire survey respondents. Retrospective platform-member survey. Does not constitute a probability sample of every US marriage.